Polemic

Hamish Campbell – Aotearoa New Zealand

GitHub Twitter LinkedIn Keybase

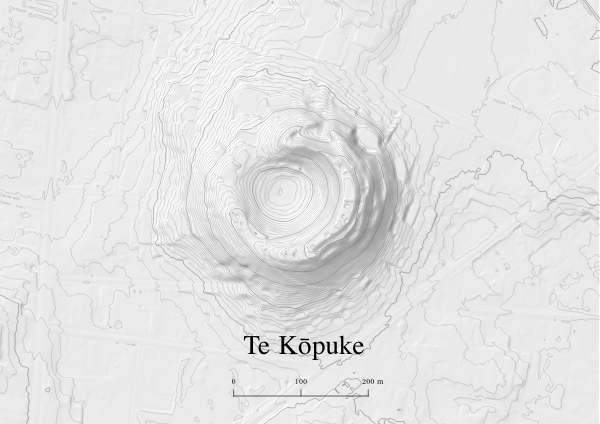
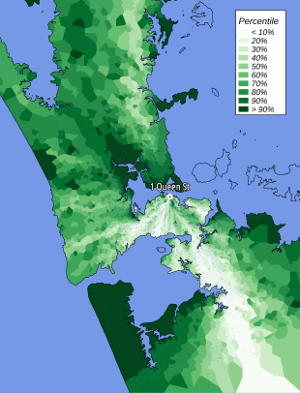
Maungawhau / Mt Eden

11 Apr 2019

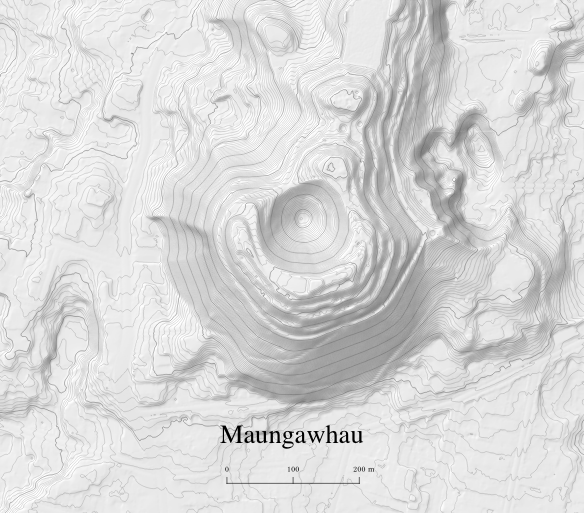
Maungawhau / Mount Eden forms the highest point in Auckland City. It has some of the best views over the city and is a prominant feature of the skyline. It erupted roughly 28,000 years through an earlier magma flow generated by Te Kōpuke. Like many of Auckland's scoria cones, it was subjected to various human interferences over the years: a resourvior is built into the northern side, the western side was quarried away, and various buildings have been constructed and since removed from the peak. Fortunately it is now under collective management by Auckland Council and local iwi to preserve it for future generations.

Read more (full size map) »

Te Kōpuke / Mount Saint John

08 Apr 2019

Te Kōpuke / Mt Saint John is one of Auckland's many peaks in the Auckland volcanic field, and one of our most underrated cones if you ask me. Unfortunately it is obscured by housing these days, but a look at the Lidar-derived elevation model reveals its exceptionally round scoria cone shape. If you know Auckland's geography, you might be surprised to learn it is the source of the lava flow that built Meola Reef in the Waitematā Harbour. Until recently it was thought the reef was formed by the eruption of Te Tatua-a-Riukiuta / Three Kings but geochemical testing revealed that Maungawhau had erupted through an earlier lava flow from Te Kōpuke, obscuring it's true source.

Read more (full size map) »

Auckland Cycleways

02 Apr 2019

I've been working with some cycling data recently, and the good people at Bike Auckland have asked if they can post a little map I made the other day. This is a quick look at Aucklands cycling infrastructure as of March 2019, from the Auckland Transport GIS open data portal. Check out the Bike Auckland blog post for an extended look at the state of cycling in Auckland today.

Read more (full size map) »

Of Suburbs and Open Data Barriers

10 Sep 2015

This is a a follow-up to my first Auckland Suburbs map. As I outlined earlier, the only authoritative suburbs dataset for New Zealand is the NZ Localities dataset. The data is maintained by the New Zealand Fire Service Commission (NZFSC) and has been the subject of one of the longest running OIA disputes in NZ.

Read more (full size map) »

Red Peak

06 Sep 2015

A lot has already been said about our flag selection process. I'm one of many that believe the selection panel dropped the ball at the final hurdle. Despite the huge number of submissions, and an adequately promising long-list, the final four leave a lot to be desired.

Read more (full size map) »

Rivers of New Zealand

20 Mar 2015

New Zealand's Ministry for the Environment recently launched their new Data Service. It's another excellent source of open data and a sign that the 'open data dam' has truly burst.

Read more (full size map) »

World Hexes

27 Feb 2015

Last hex map for a while, I promise! Strapped for time this week so I was lazy and used the same method as the previous map. This map uses a world country boundaries in a decimal degrees projection (WSG84) with 2.5 degree edge (5 degree span) hexes.

Read more (full size map) »

NZ Population Hexbins

20 Feb 2015

I've been thinking a lot about hexbin maps lately, after an earlier exploration of employment centers. In the previous map, I generated the hexbin with a QGIS plug-in and manually fixed up coastal hexes in a very non-reproducible way.

Read more (full size map) »

Auckland Suburbs - Part 1

23 Jan 2015

So, suburbs. You're probably looking at this map and wondering "what's the big deal?". It's a terrible map of the suburbs of Auckland. There are lots of holes. Some bits are downright inaccurate. And you'd be right to wonder. Then again, you might be someone who has once tried to acquire an authoritative, free and open dataset of suburbs for Auckland (or, better yet, the whole of New Zealand).

Read more (full size map) »

Auckland Employment Centres

16 Jan 2015

A recent Auckland Transport Blog post highlighted one of my biggest bugbears about misleading cartography - using fill symbology from absolute values that are dependant on the area of the underlying polygons. It seemed like as good excuse as any to try out hexbinning as an alternative method of looking at the data.

Read more (full size map) »

Kiwicon 8

12 Dec 2014

Today's map is a small tribute to Kiwicon 8 - New Zealand's hacker conference that I'm currently attending. The theme this year is "It's always 1989 in computer security". It's been an excellent conference so far and the crüe have put on an amazing show (a real life Delorean, for one!).

Read more (full size map) »

Population Proportional Meshblocks

05 Dec 2014

My last map visualised the NZ deprivation index by meshblock. It provided a quick regional overview of deprivation however it obscures the effects of population density. This week I wanted to explore different ways to present the NZ meshblock dataset that emphasises population distribution over geographic location.

Read more (full size map) »

New Zealand Deprivation Index (2013)

28 Nov 2014

The New Zealand Deprivation Index is a key socioeconomic indicator produced by the University of Otago Department of Public Health.

Read more (full size map) »

Azimuth Orthographic Projections with QGIS

21 Nov 2014

This is an example of an azimuthal orthographic projection of the earth centered on New Zealand. Creating maps with azimuthal orthographic projections in QGIS requires a few tricks to get right, so here is a short tutorial on setting up the coordinate system, making your data work in the projection, and generating grid lines.

Read more (full size map) »

New Zealand Historic Earthquakes

14 Nov 2014

New Zealand is sometimes called the Shakey Isles and it's not hard to see why. This map shows all earthquakes in New Zealand from GeoNet, the earthquake monitoring service provided by GNS Science. This data has been extracted from the GeoNet WFS servce and filtered for earthquakes local to New Zealand.

Read more (full size map) »

Auckland Downtown Proximity

07 Nov 2014

This map shows the relationship between the "direct" (crow flies) distance and "shortest path" (via roads) from 1 Queen Street (downtown) and the rest of Auckland, via the road network. Percentiles describe the relative 'directness' of the path - the lightest shade polygons are in the 10% most direct paths to town, the darkest are the 10% least direct.

Read more (full size map) »

New Zealand Extruded

31 Oct 2014

Adding depth to a map can make it stand out (pun unintended), but it can be difficult to generate 3d perspective from a flat plane within QGIS. In this example, depth outlines are created with marker symbolizers of vertical lines, offset vertically and overlaied with another copy of the layer. The urban areas layer is additionally offset to create the built-up effect. Labels are created with white text, a black buffer and drop shadow.

Read more (full size map) »

Auckland Circuit Board

24 Oct 2014

I was lacking for time this week, so this is the result of an earlier experiment with QGIS symbolizers. It's an attempt to produce a circuit board type diagram of an Auckland central suburb. Getting the track detail around the pin holes is especially fiddly. Some post-processing in GIMP to give the base board a bit of extra texture too.

Read more (full size map) »

New Zealand Roads

16 Oct 2014

This is a quick map showing New Zealand roads from the Land Information New Zealand Mainland Roads Centrelines (1:250k) dataset (and nothing else), inspired by this map of U.S. Roads. Road centrelines are symbolized with lighter to darker shades of blue based on the data lanes attribute.

Read more (full size map) »

New Zealand Mean Annual Temperature

10 Oct 2014

Landcare Research is a New Zealand CRI (Crown Research Institute) that studies the natural environment of New Zealand. They pubish a wealth of scientific data - here is a visualisation of New Zealand's mean annual temperature, from historic records. Background hillshades were privided by LINZ and the offshore bathymetry pattern from NIWA.

Read more (full size map) »

Waiheke and Ponui Islands

09 Oct 2014

A neon map of the islands of Waiheke and Ponui in Auckland's Hauraki Gulf. The effect is created by generated a roughness map from an elevation model of the islands.

Read more (full size map) »