Azimuth Orthographic Projections with QGIS
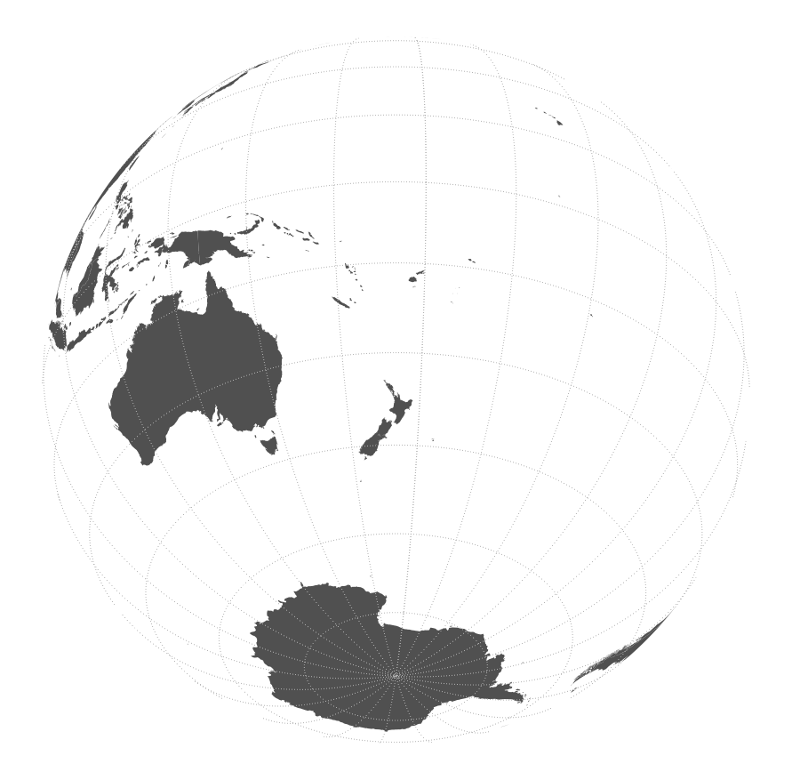
This is an example of an azimuthal orthographic projection of the earth centered on New Zealand. Creating maps with azimuthal orthographic projections in QGIS requires a few tricks to get right, so here is a short tutorial on setting up the coordinate system, making your data work in the projection, and generating grid lines.
Wired magazine runs a series about maps, most recently discussing Azimuthal Orthographic projections.
The azimuthal orthographic is all about perspective. It also has geometric distortions, but only for tricking your brain into believing that the continents really are wrapping themselves realistically around the horizon. It is so good at doing this that it makes us see the world as if we were hundreds of thousands of miles away in space, and write the experience off as mundane. — Wired Magazine
They are great to look at, but creating maps with azimuthal orthographic projections in QGIS requires a few tricks to get right.
1. Defining your projection
Usually you want your map to focus on a specific point on the Earth. You can define a custom coordinate reference system in QGIS from the "Settings" menu. Add a new CRS with the projection parameters like so:
+proj=ortho +lat_0=-36 +lon_0=175 +x_0=0 +y_0=0 +a=6371000 +b=6371000 +units=m +no_defs
Replace the lat_0 and long_0 values with the location you
want to centre your map. In this case, we're approximately
centering the map on New Zealand. Give the CRS a useful name.
Now you can choose this CRS as your project's coordinate system from the project properties dialog. Check "Enable 'on the fly' CRS transformations" to see your data projected to this sytem.
2. Fixing artifacts
Loading up a world dataset I used this world country boundaries layer will usually expose a bunch of rendering artifacts. Fortunately I found a handy python script to clip your geometries to within the visible area.
This is copied from this excellent GIS Stackexchange answer:
import numpy as np
from qgis.core import *
import qgis.utils

import sys, os, imp
import fTools
path = os.path.dirname(fTools.__file__)
ftu = imp.load_source('ftools_utils', os.path.join(path,'tools','ftools_utils.py'))


def doClip(iface, lat=30, lon=110, filename='result.shp'):
    sourceLayer = iface.activeLayer()

    sourceCrs = sourceLayer.dataProvider().crs()

    targetProjString = "+proj=ortho +lat_0=" + str(lat) + " +lon_0=" + str(lon) + "+x_0=0 +y_0=0 +a=6370997 +b=6370997 +units=m +no_defs"
    targetCrs = QgsCoordinateReferenceSystem()
    targetCrs.createFromProj4(targetProjString)

    transformTargetToSrc = QgsCoordinateTransform(targetCrs, sourceCrs).transform

    def circlePolygon(nPoints=20, radius=6370000, center=[0,0]):
        clipdisc = QgsVectorLayer("Polygon?crs=epsg:4326", "Clip disc", "memory")
        angles = np.linspace(0, 2*np.pi, nPoints, endpoint=False)
        circlePoints = np.array([ transformTargetToSrc(QgsPoint(center[0]+np.cos(angle)*radius, center[1]+np.sin(angle)*radius)) for angle in angles ])
        sortIdx = np.argsort(circlePoints[:,0])
        circlePoints = circlePoints[sortIdx,:]
        circlePoints = [ QgsPoint(point[0], point[1]) for point in circlePoints ]
        circlePoints.extend([QgsPoint(180,circlePoints[-1][1]), QgsPoint(180,np.sign(lat)*90), QgsPoint(-180,np.sign(lat)*90), QgsPoint(-180,circlePoints[0][1])])
        circle = QgsFeature()
        circle.setGeometry(QgsGeometry.fromPolygon( [circlePoints] ) )
        clipdisc.dataProvider().addFeatures([circle])
        QgsMapLayerRegistry.instance().addMapLayer(clipdisc)
        return clipdisc

    auxDisc = circlePolygon(nPoints = 3600)

    ###### The clipping stuff
    ## Code taken from the fTools plugin

    vproviderA = sourceLayer.dataProvider()
    vproviderB = auxDisc.dataProvider()

    inFeatA = QgsFeature()
    inFeatB = QgsFeature()
    outFeat = QgsFeature()

    fitA = vproviderA.getFeatures()

    nElement = 0
    writer = QgsVectorFileWriter( filename, 'UTF8', vproviderA.fields(),
                                  vproviderA.geometryType(), vproviderA.crs() )

    index = ftu.createIndex( vproviderB )

    while fitA.nextFeature( inFeatA ):
      nElement += 1
      geom = QgsGeometry( inFeatA.geometry() )
      atMap = inFeatA.attributes()
      intersects = index.intersects( geom.boundingBox() )
      first = True
      found = False
      if len( intersects ) > 0:
        for id in intersects:
          vproviderB.getFeatures( QgsFeatureRequest().setFilterFid( int( id ) ) ).nextFeature( inFeatB )
          tmpGeom = QgsGeometry( inFeatB.geometry() )
          if tmpGeom.intersects( geom ):
            found = True
            if first:
              outFeat.setGeometry( QgsGeometry( tmpGeom ) )
              first = False
            else:
              try:
                cur_geom = QgsGeometry( outFeat.geometry() )
                new_geom = QgsGeometry( cur_geom.combine( tmpGeom ) )
                outFeat.setGeometry( QgsGeometry( new_geom ) )
              except:
                GEOS_EXCEPT = False
                break
        if found:
          try:
            cur_geom = QgsGeometry( outFeat.geometry() )
            new_geom = QgsGeometry( geom.intersection( cur_geom ) )
            if new_geom.wkbType() == 0:
              int_com = QgsGeometry( geom.combine( cur_geom ) )
              int_sym = QgsGeometry( geom.symDifference( cur_geom ) )
              new_geom = QgsGeometry( int_com.difference( int_sym ) )
            try:
              outFeat.setGeometry( new_geom )
              outFeat.setAttributes( atMap )
              writer.addFeature( outFeat )
            except:
              FEAT_EXCEPT = False
              continue
          except:
            GEOS_EXCEPT = False
            continue
    del writer

    resultLayer = QgsVectorLayer(filename, sourceLayer.name() + " - Ortho: Lat " + str(lat) + ", Lon " + str(lon), "ogr")
    QgsMapLayerRegistry.instance().addMapLayer(resultLayer)
Copy that somewhere in your python path. I saved it as clipper.py in my QGIS python folder.
From QGIS you can now import and use the script from the python console. Select the data layer you want to show, open the console and use it like so:
import clipper
clipper.doClip(iface, -36, 175)
(Use your own latitude / longitude values here too!)
The result will be a copy of the layer clipped to the visible area of the projected map. If you use this layer instead of the unclipped version, your map should render correctly.
3. Grid Lines
In the map above, there are 15 degree latitude / longtiude grid lines. To create the grids, set your CRS back to a global proectoin (e.g. WSG84 so I can create a regular degree-based grid) and build a line grid with the QGIS "Vector grid" function (see "Vector" » "Research Tools"). Now use the "Densify geometries" tool (see "Vector" » "Geometry Tools") to add additional points (e.g. 50) to the line. This means the line maintains it's correct shape during reprojetion.
Set the map projection back to your custom azimuthal CRS, create your symbology, and you have a global azimuthal orthogrpahic map of your very own!