FOSS4G / QGIS Geometry Generators
Last week I was fortunate to attend and present at FOSS4G SOTM1 Oceania. The conference, now in it's second year, brings together Open Source developers & users in GIS, as well as the Oceania OpenStreetMap communities, for a total of 4 days of workshops, talks and community events.
Hooorraayy pic.twitter.com/PmlNzJ5TTb
— FOSS4G SotM Oceania (@FOSS4G_Oceania) November 14, 2019
Durign the lightening talk session I gave a brief introduction to QGIS Geometry Generators. I've had a few requests for more detail on the techniques covered.
What is a Geometry Generator
A Geometry Generator is a symbol layer type that lets you use code to create new geometries from existing features, and use the new 'generated' geometries as symbols that can, in turn, have styles applied.
This is a powerful feature best explained with an example.
Note that many of these generators rely on functions released in version 3.10, and I recommend you upgrade your QGIS version if you haven't done so already!
Creating a Buffer
Let's say we have a simple points layer, like so:
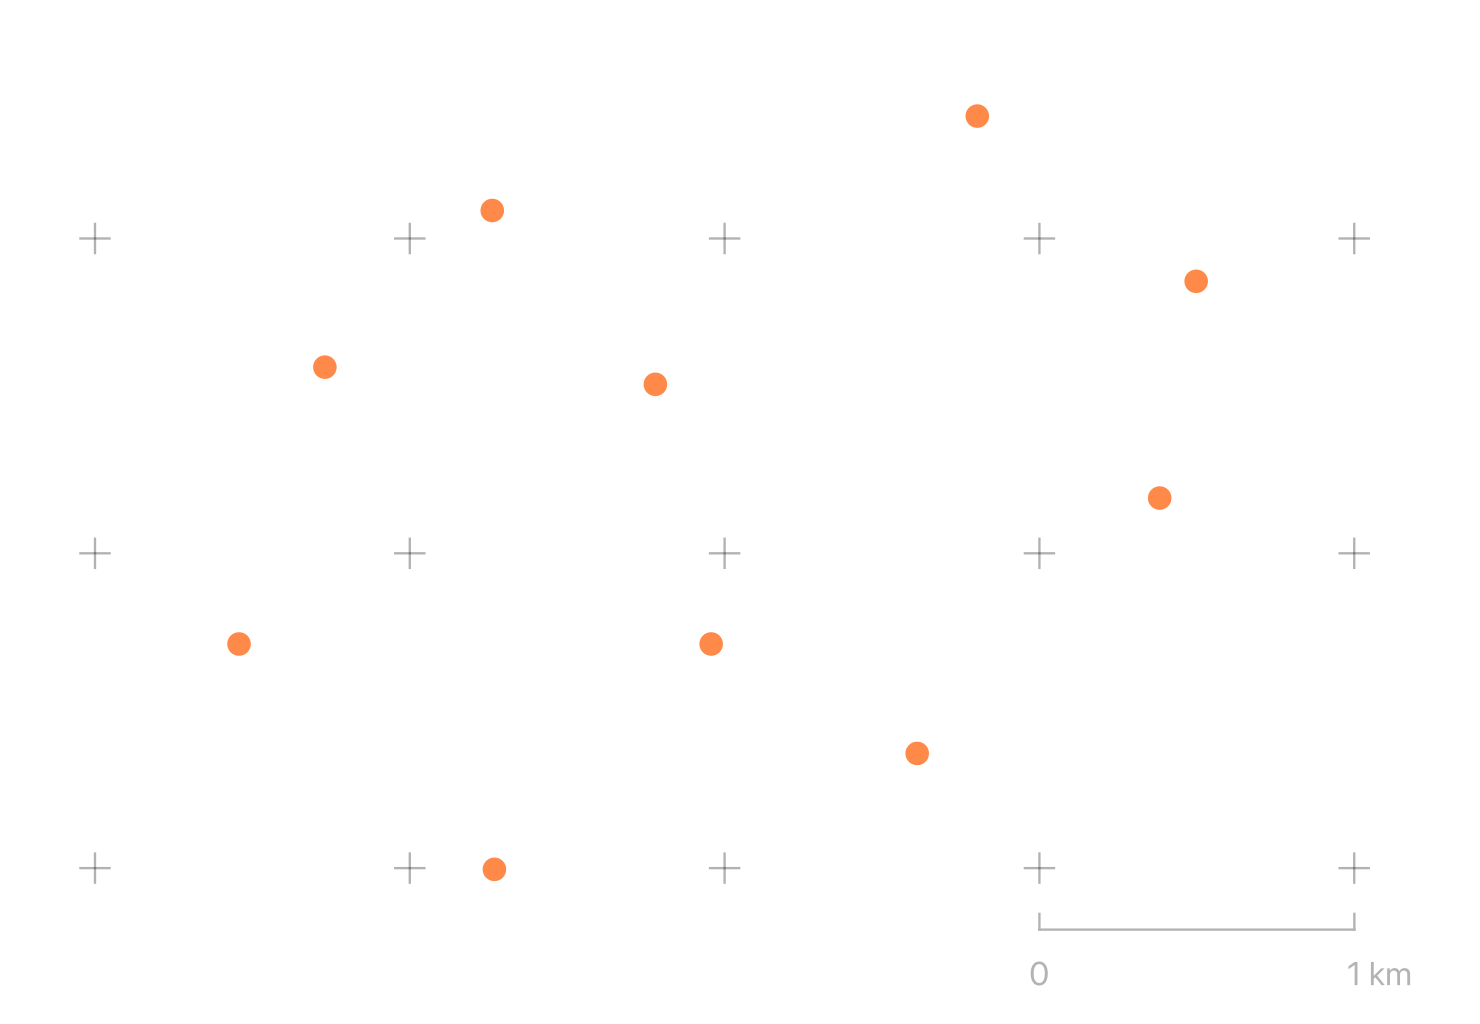
We can open the layer symbology and select a "Geometry Generator" style layer with a simple expression
buffer($geometry, 100)
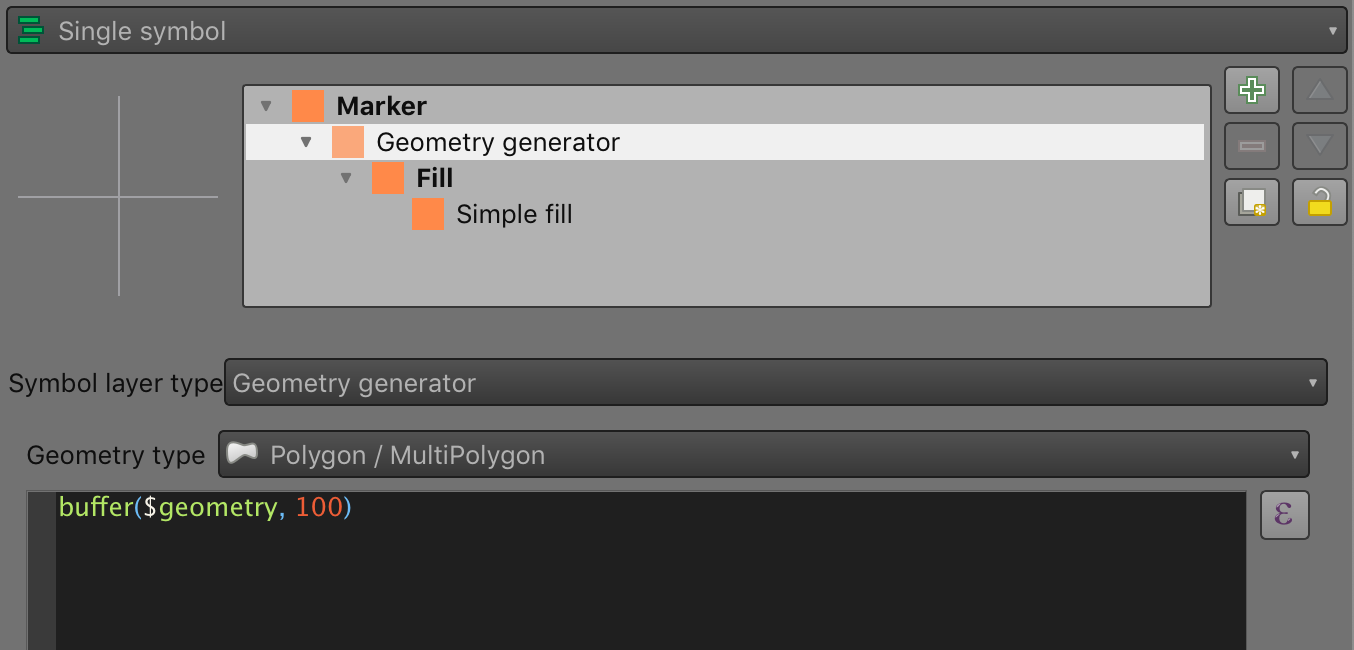
It's important to note the "Geometry Type" option here - it must match the output of the expression. In
this case, the input is a point layer, and the buffer generates a 100m buffered polygon for each feature
geometry referred to by the variable $geometry.
The result is what you might expect:
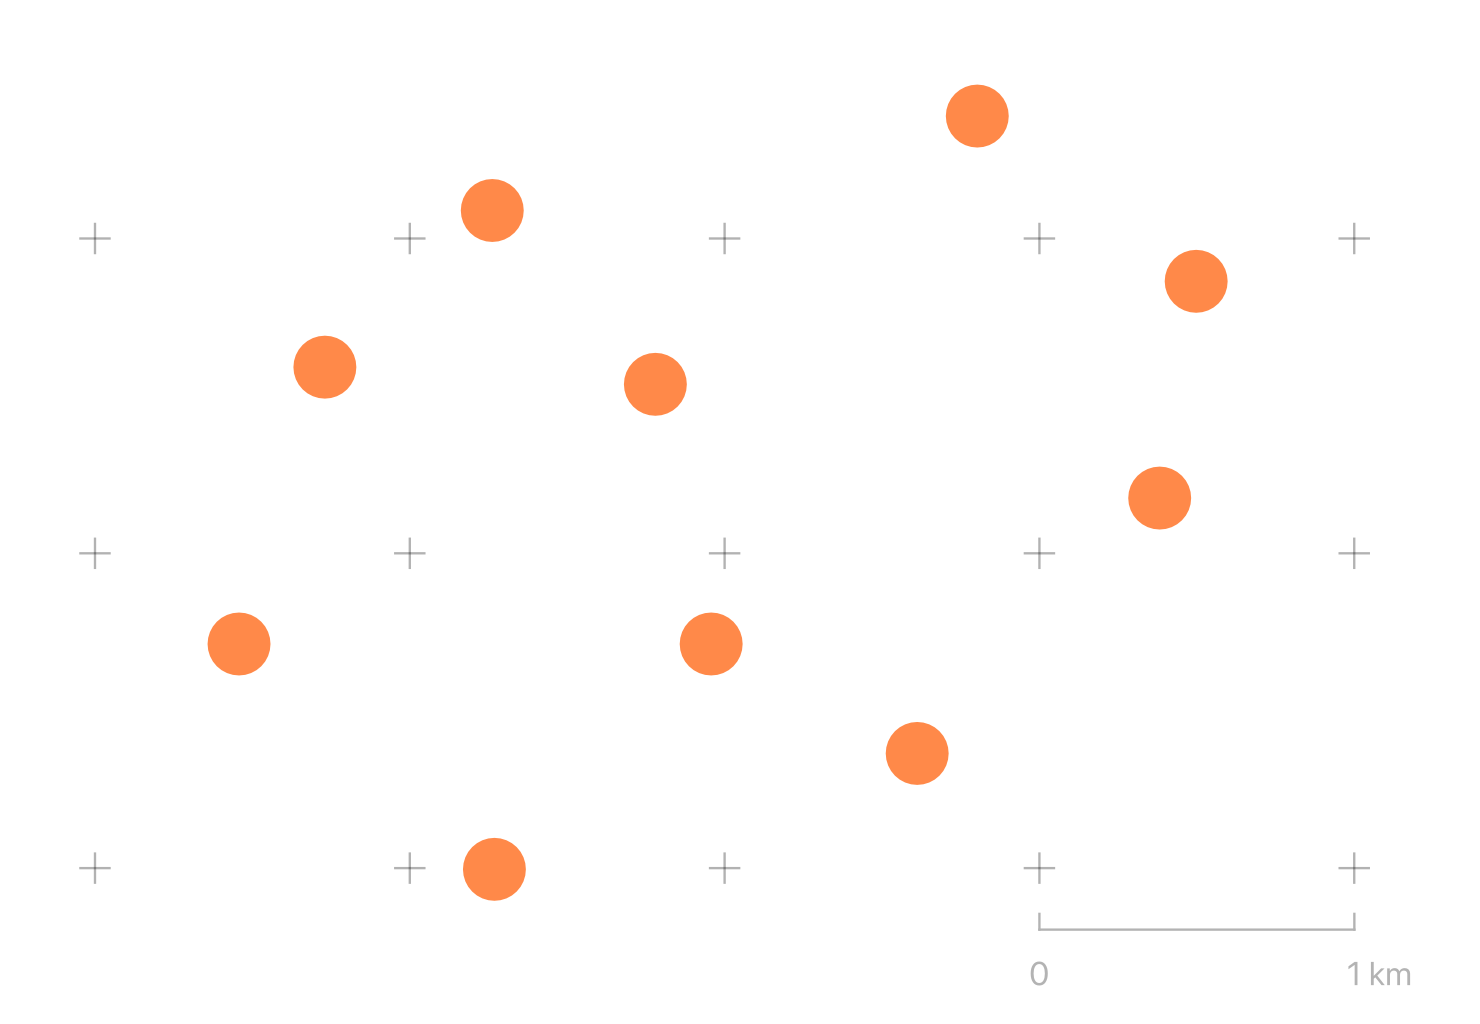
So far not very exciting. You could have just used a standard marker symbol with a radius of 50 metres at scale, for example. Except to note that this buffer will be correctly projected over larger scales, and that this can be applied to any type of geometry - lines, points or polygons, to give the same effect.
Using Built-in Variables
Now we'll add a second symbol to the same points layer, this time it's generating lines with an "arrow" symbol attached. I'll show the code, the result, and walk through what's happening:
difference(
    make_line(
        $geometry,
        @map_extent_center
    ),
    make_circle(
        @map_extent_center,
        250
    )
)
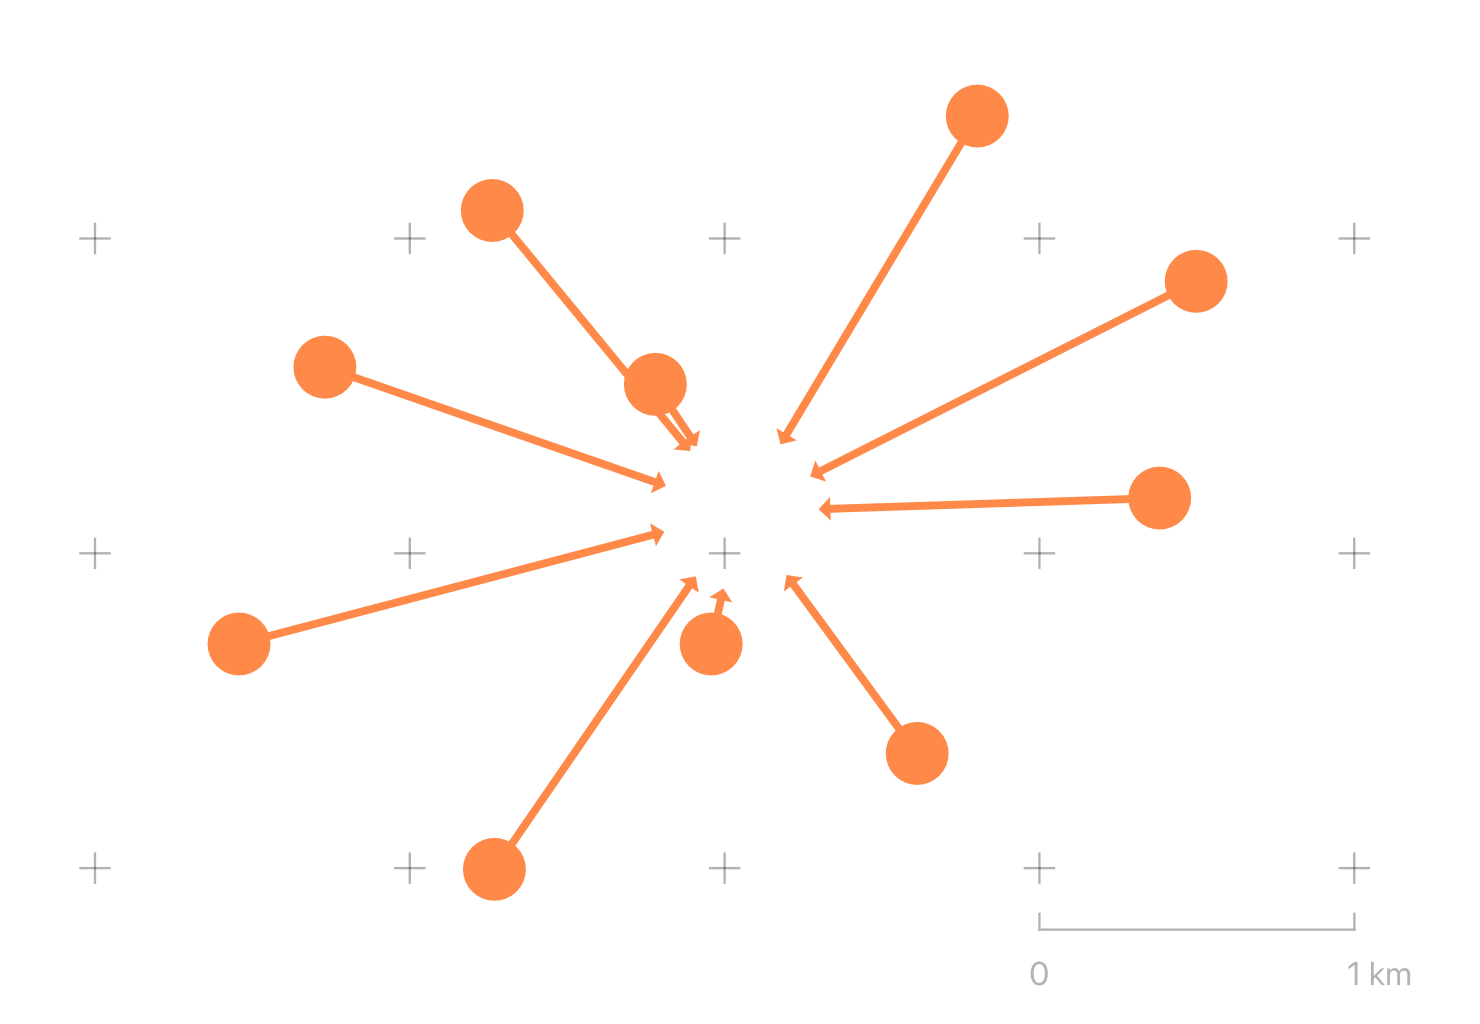
We have a number of built-in variables at our displosal. Some, like $area refer to the current feature. Others, like @map_extent_center refer to the state of the displayed map.
This expression is using make_line to generate a line from the current feature to the centre of the current
map view. Since all of our lines would converge at the map centre, I'm also using create_circle to generate a 250m circular 'mask' at the centre of the map and using difference to clip the line. The result is a series of arrows originating at our points, terminating 250m from the centre of the map.
Adding Randomness
Given a lines layer like so:
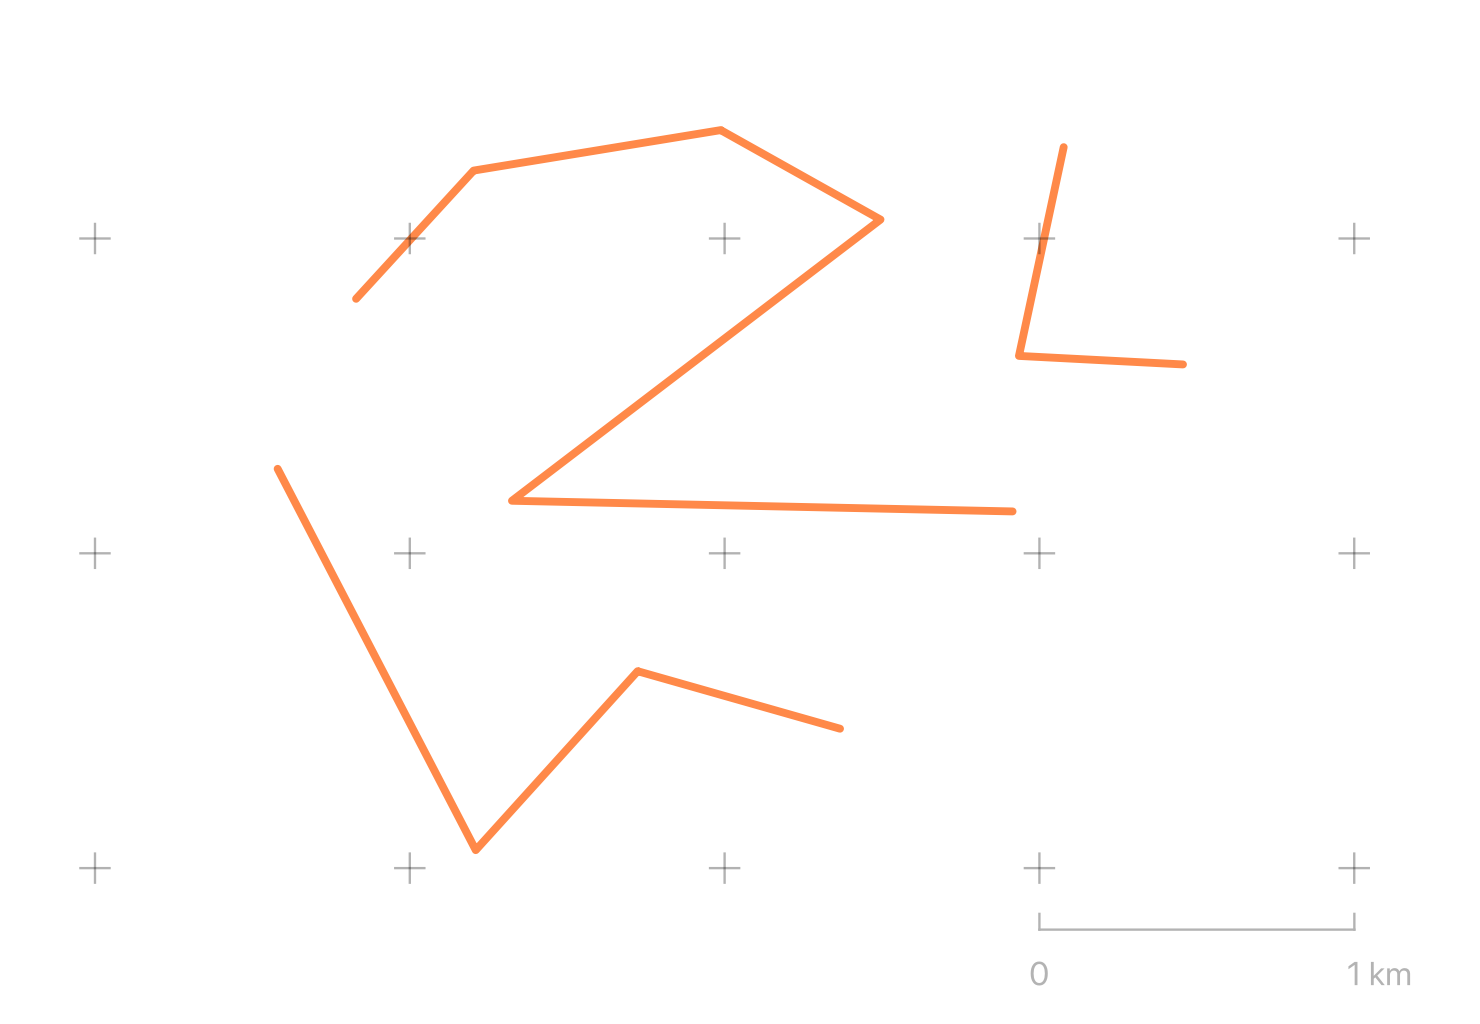
We can modify the geometry of the lines in other interesting ways using simple maths functions available
to all expressions, and by using array_foreach and generate_series to iterate over sequences.
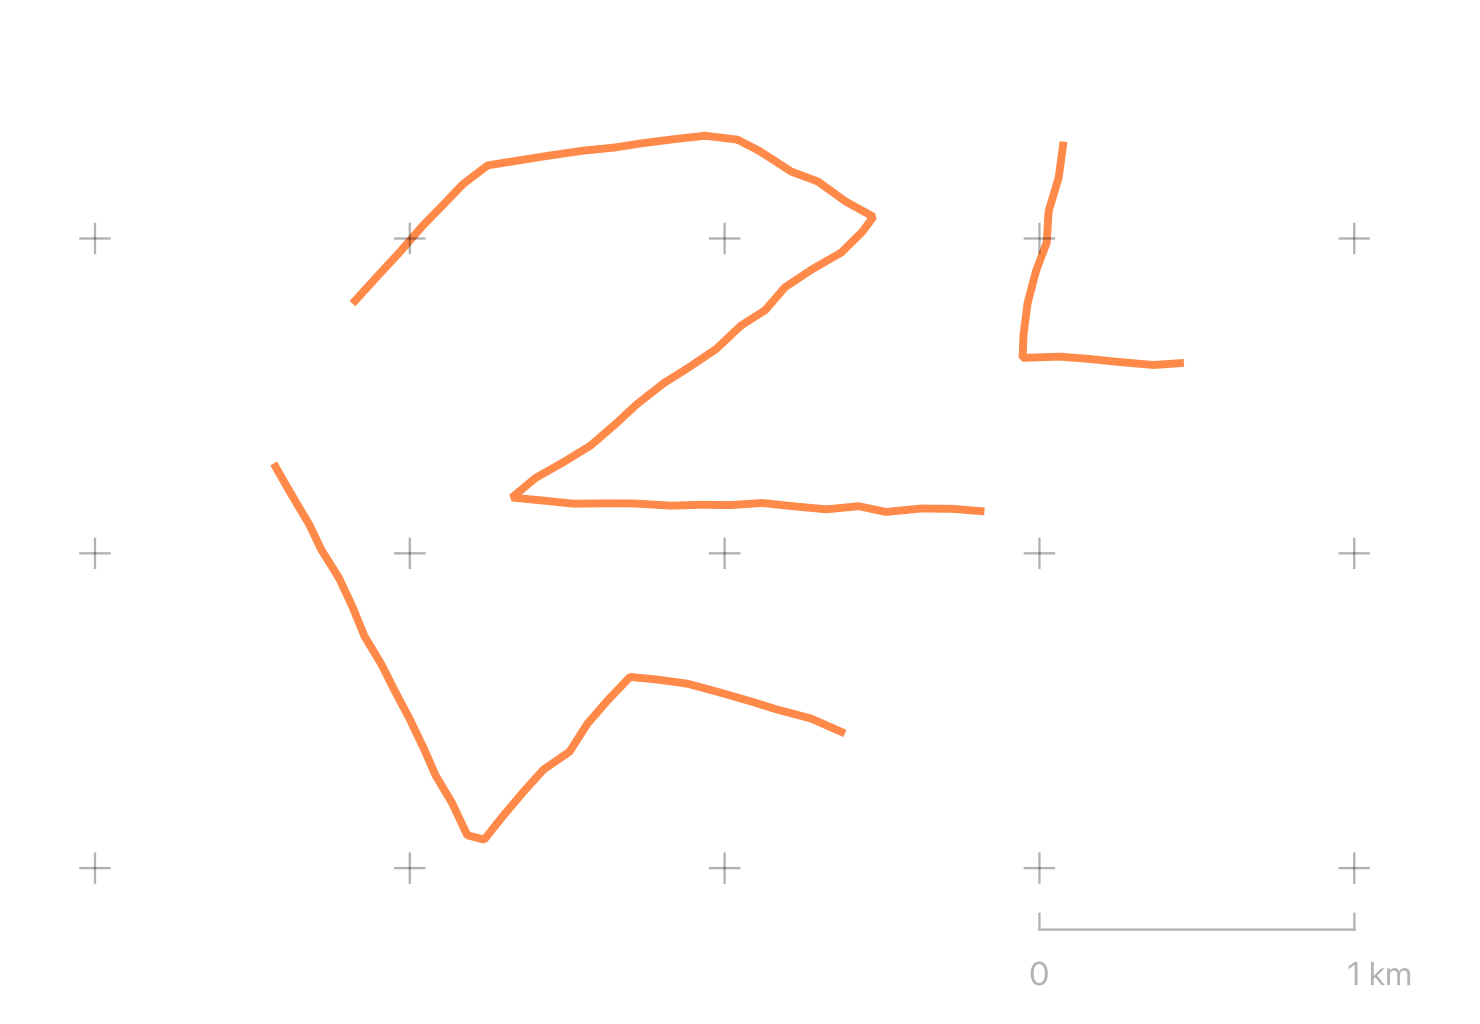
In this example, the array_foreach returns an array of points, where each point is an interpolated point
every 100m along the line, translated randomly by up to 10m vertically or horizontally. make_line then
combines the array of points back into a line.
make_line(
    array_foreach(
        generate_series(
            0, length($geometry), 100
        ),
        translate(
            line_interpolate_point($geometry, @element),
            rand(-10, 10),
            rand(-10, 10)
        )
    )
)
The result is a degree of randomness added to the output symbol:
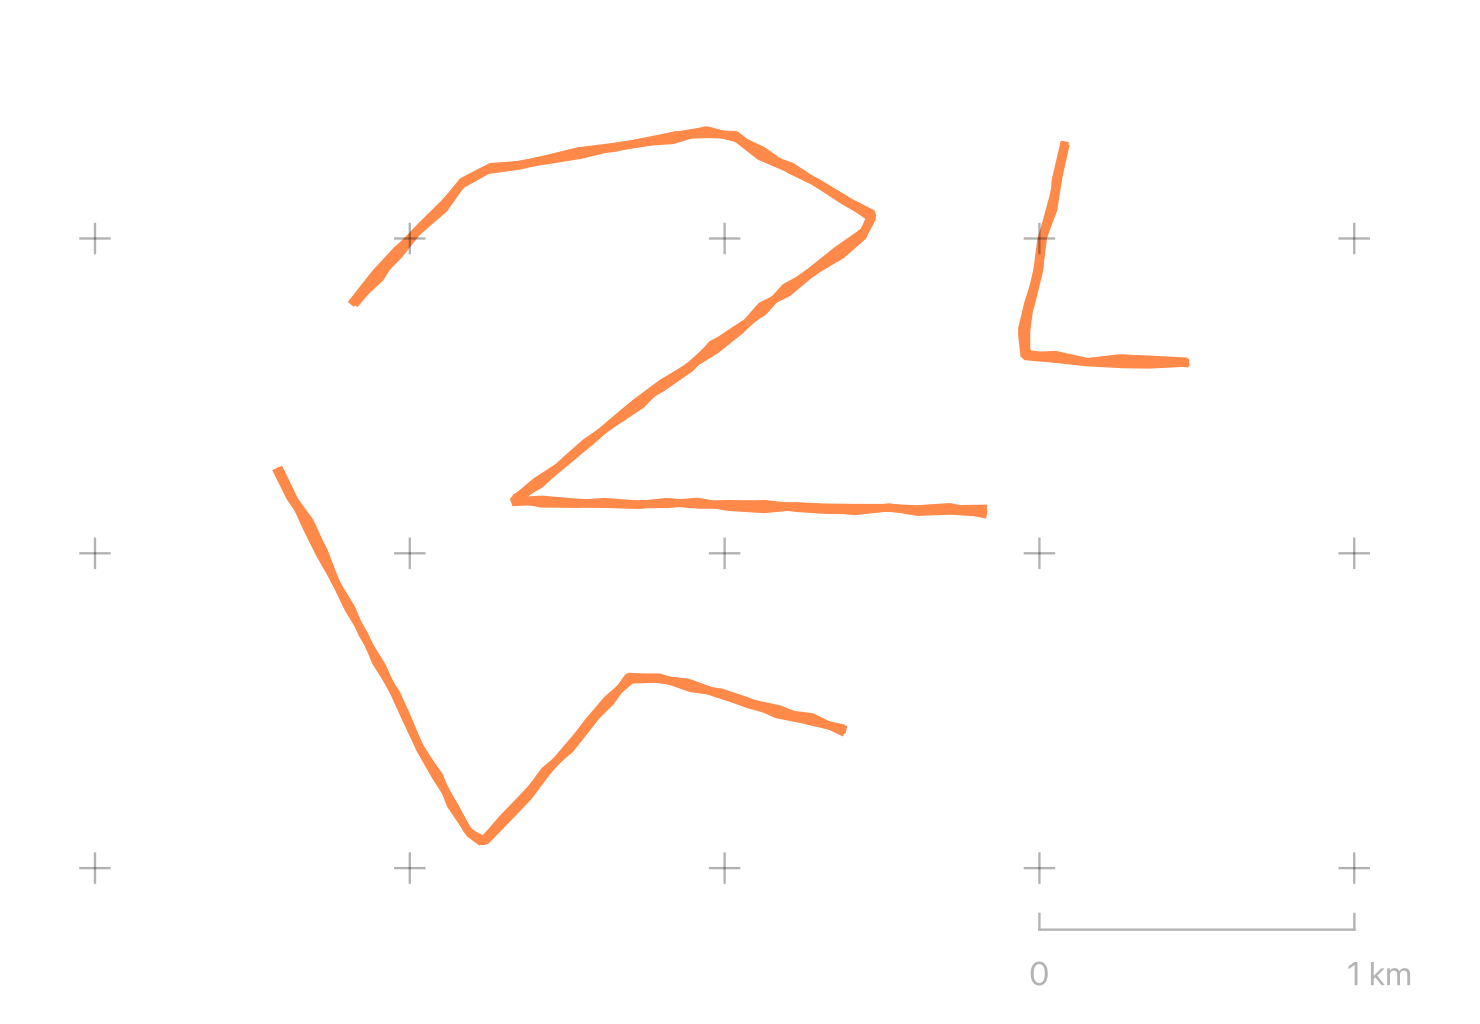
Duplicating the symbol along with the original style can give the symbol a hand-drawn effect:
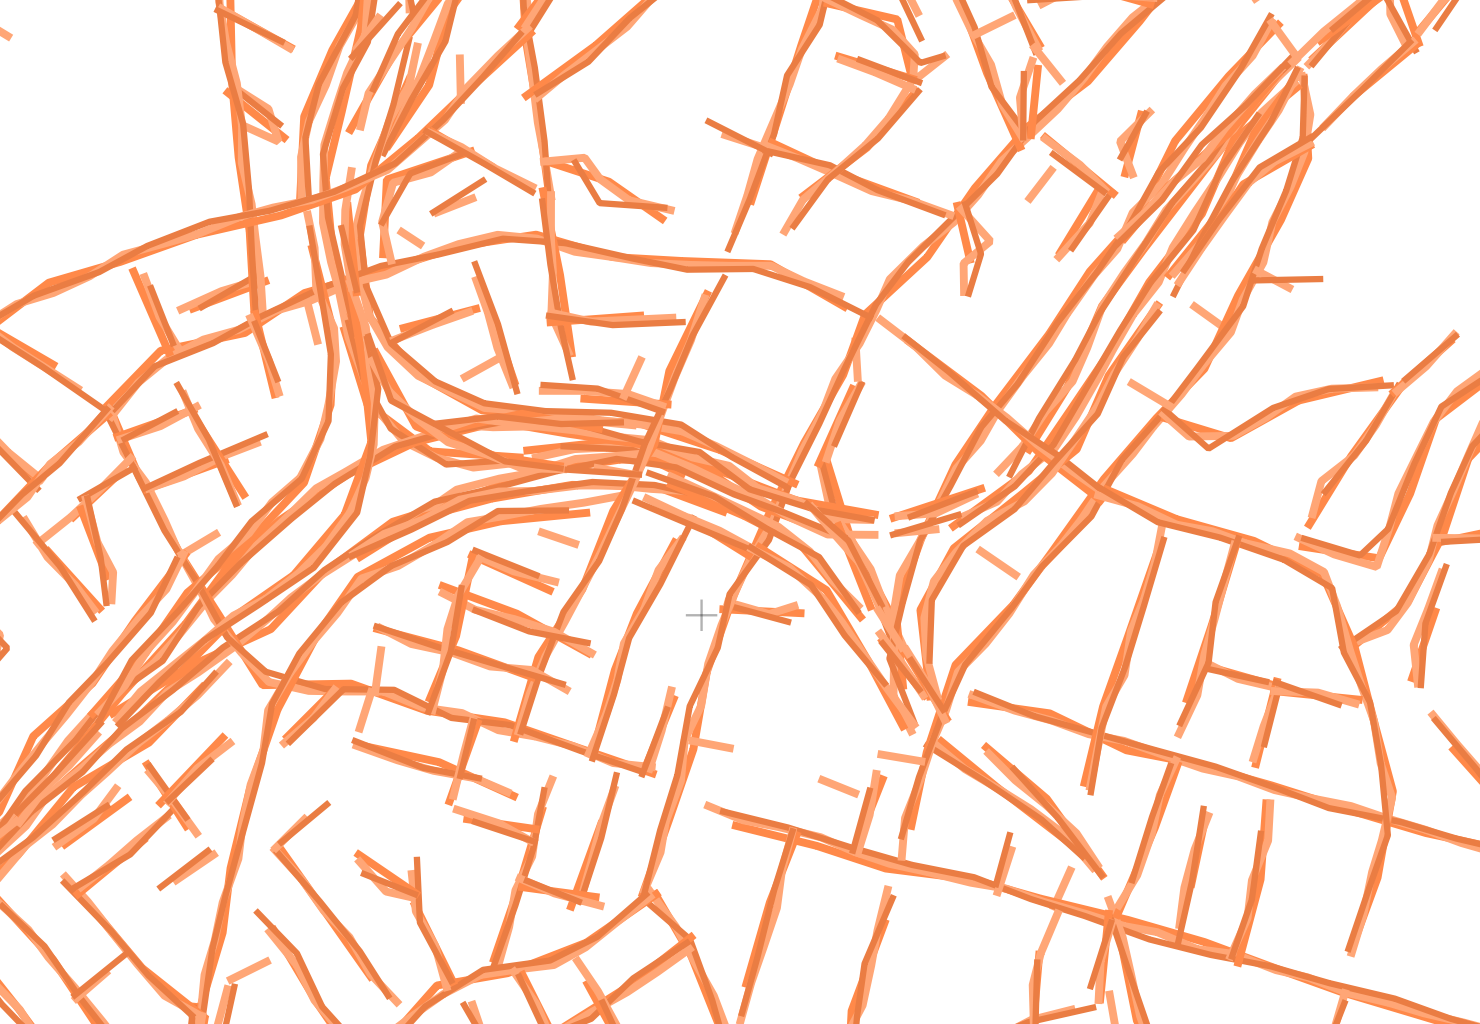
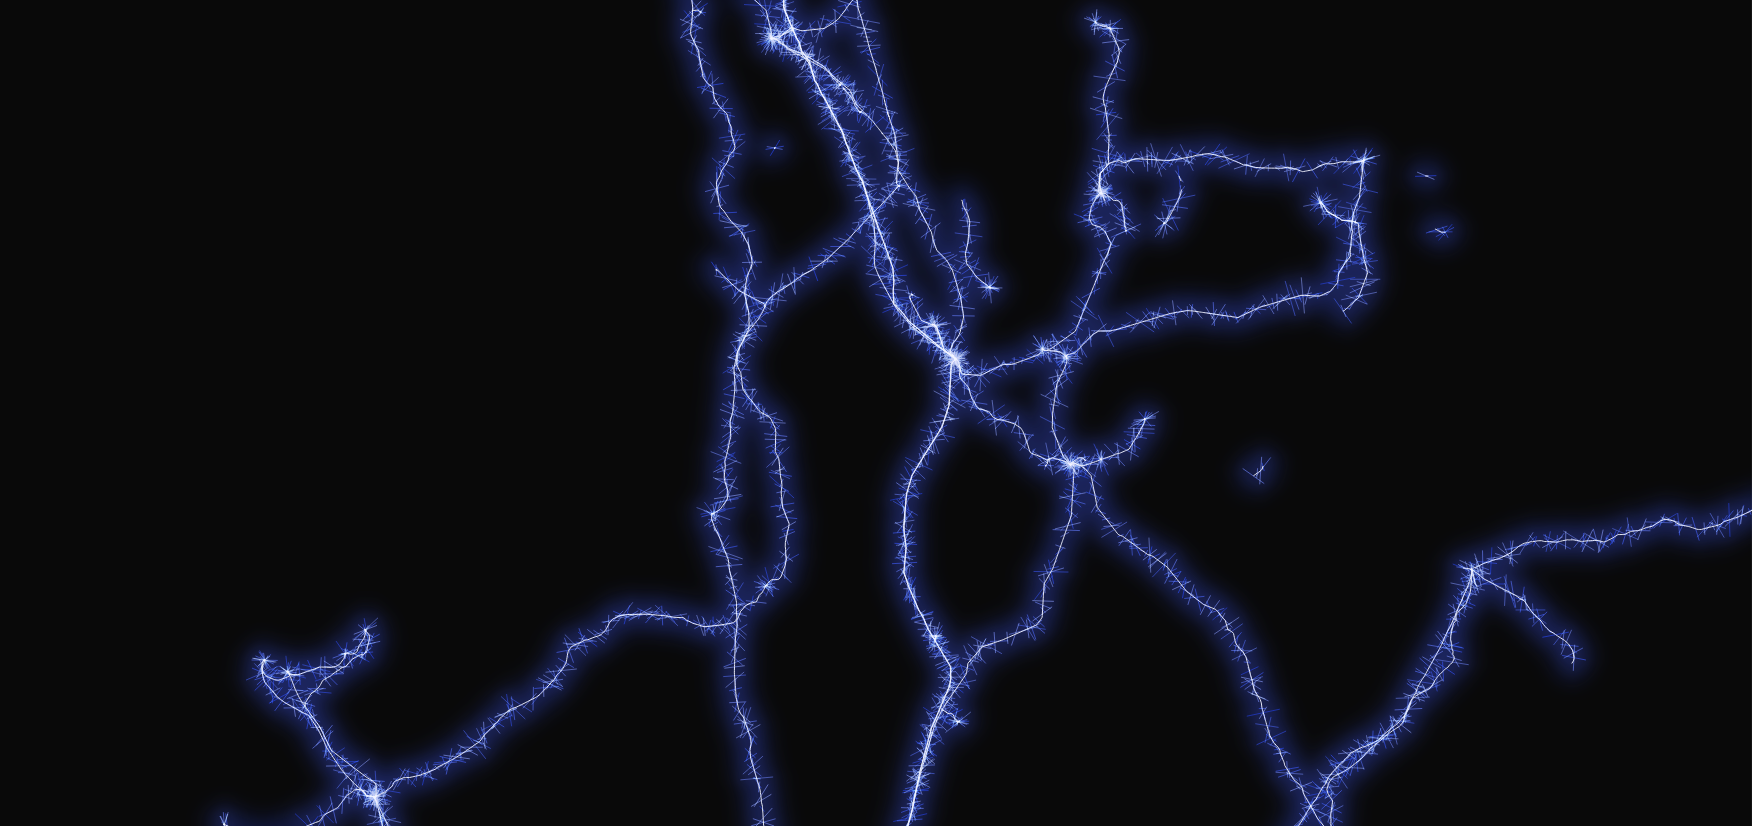
A variant of the approach where each interpolated point is randomly sprinkled with 'sparks' - a fun way to symbolise Transmission Lines from LINZ, for example:
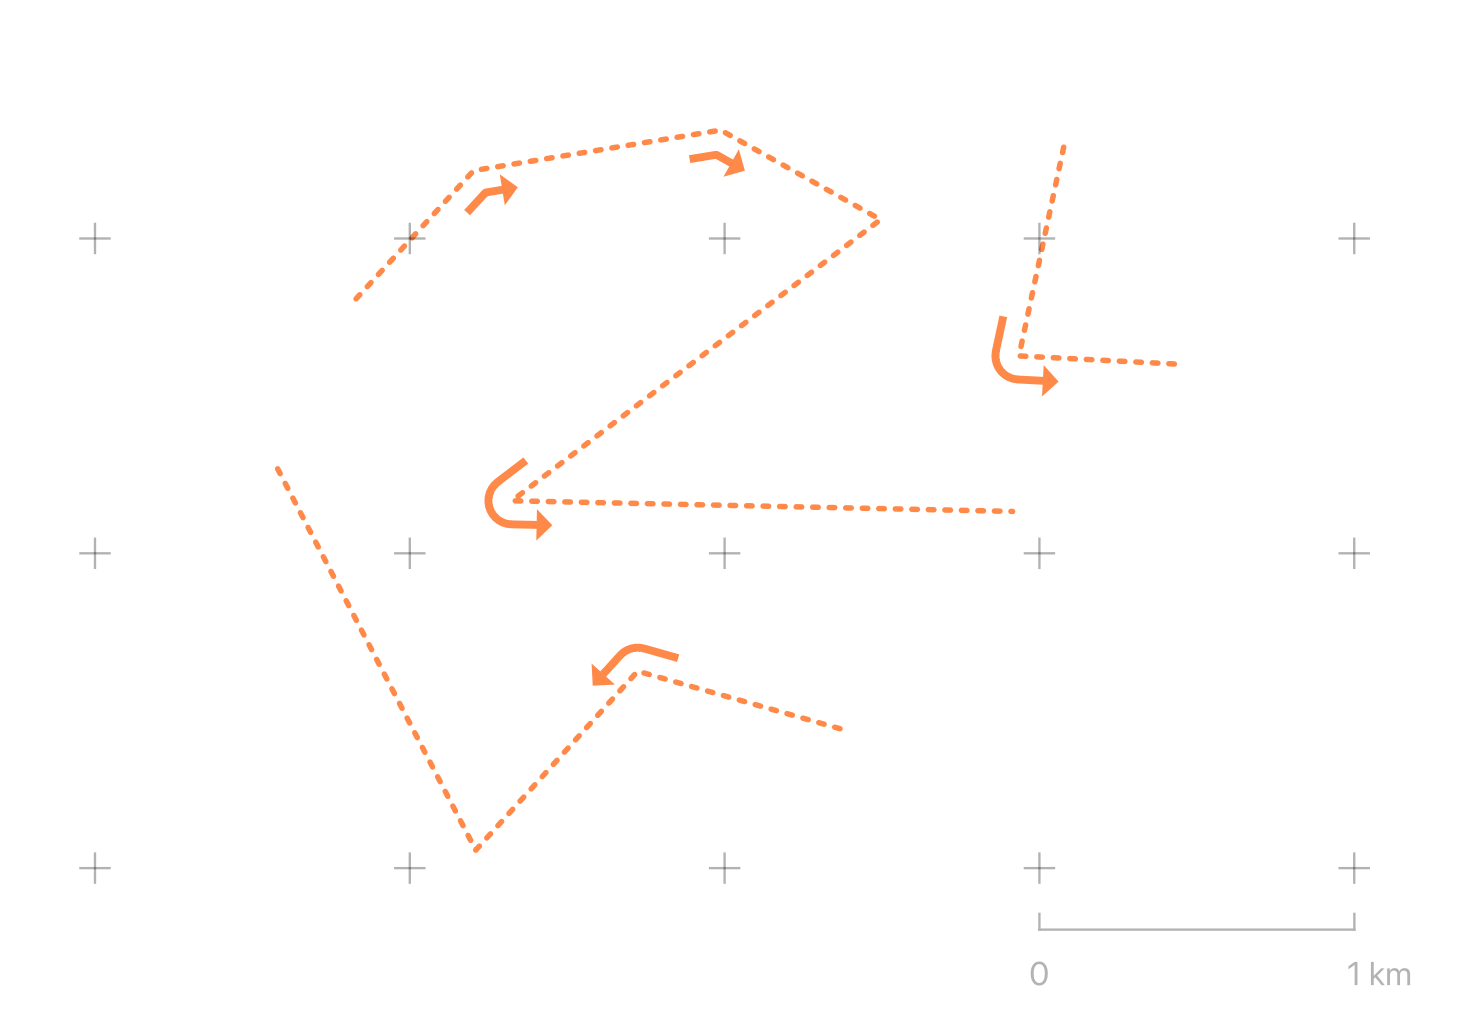
Offsets and Fancier Markup
In this example, the line_substring expression is building a set of new lines for each inner vertex
each feature – that is, for each angle in the line, it construct a simple 3-vertex line starting 100m
before and ending 100m after the inner vertex. The offset_curve function creates a rounded version of the
new lines, offset 75m to one side of the original location. collect_geometries turns the array of lines
into a single MultiLine for rendering.
collect_geometries(
    array_foreach(
        generate_series(2, num_points($geometry) - 1),
        offset_curve(
            line_substring(
                $geometry,
                 distance_to_vertex(
                    $geometry,
                    @element - 1
                ) - 100,
                distance_to_vertex(
                    $geometry,
                    @element - 1
                ) + 100
            ),
            - 75
        )
    )
)
Adding a arrow marker symbol at the end of the generated line gives:
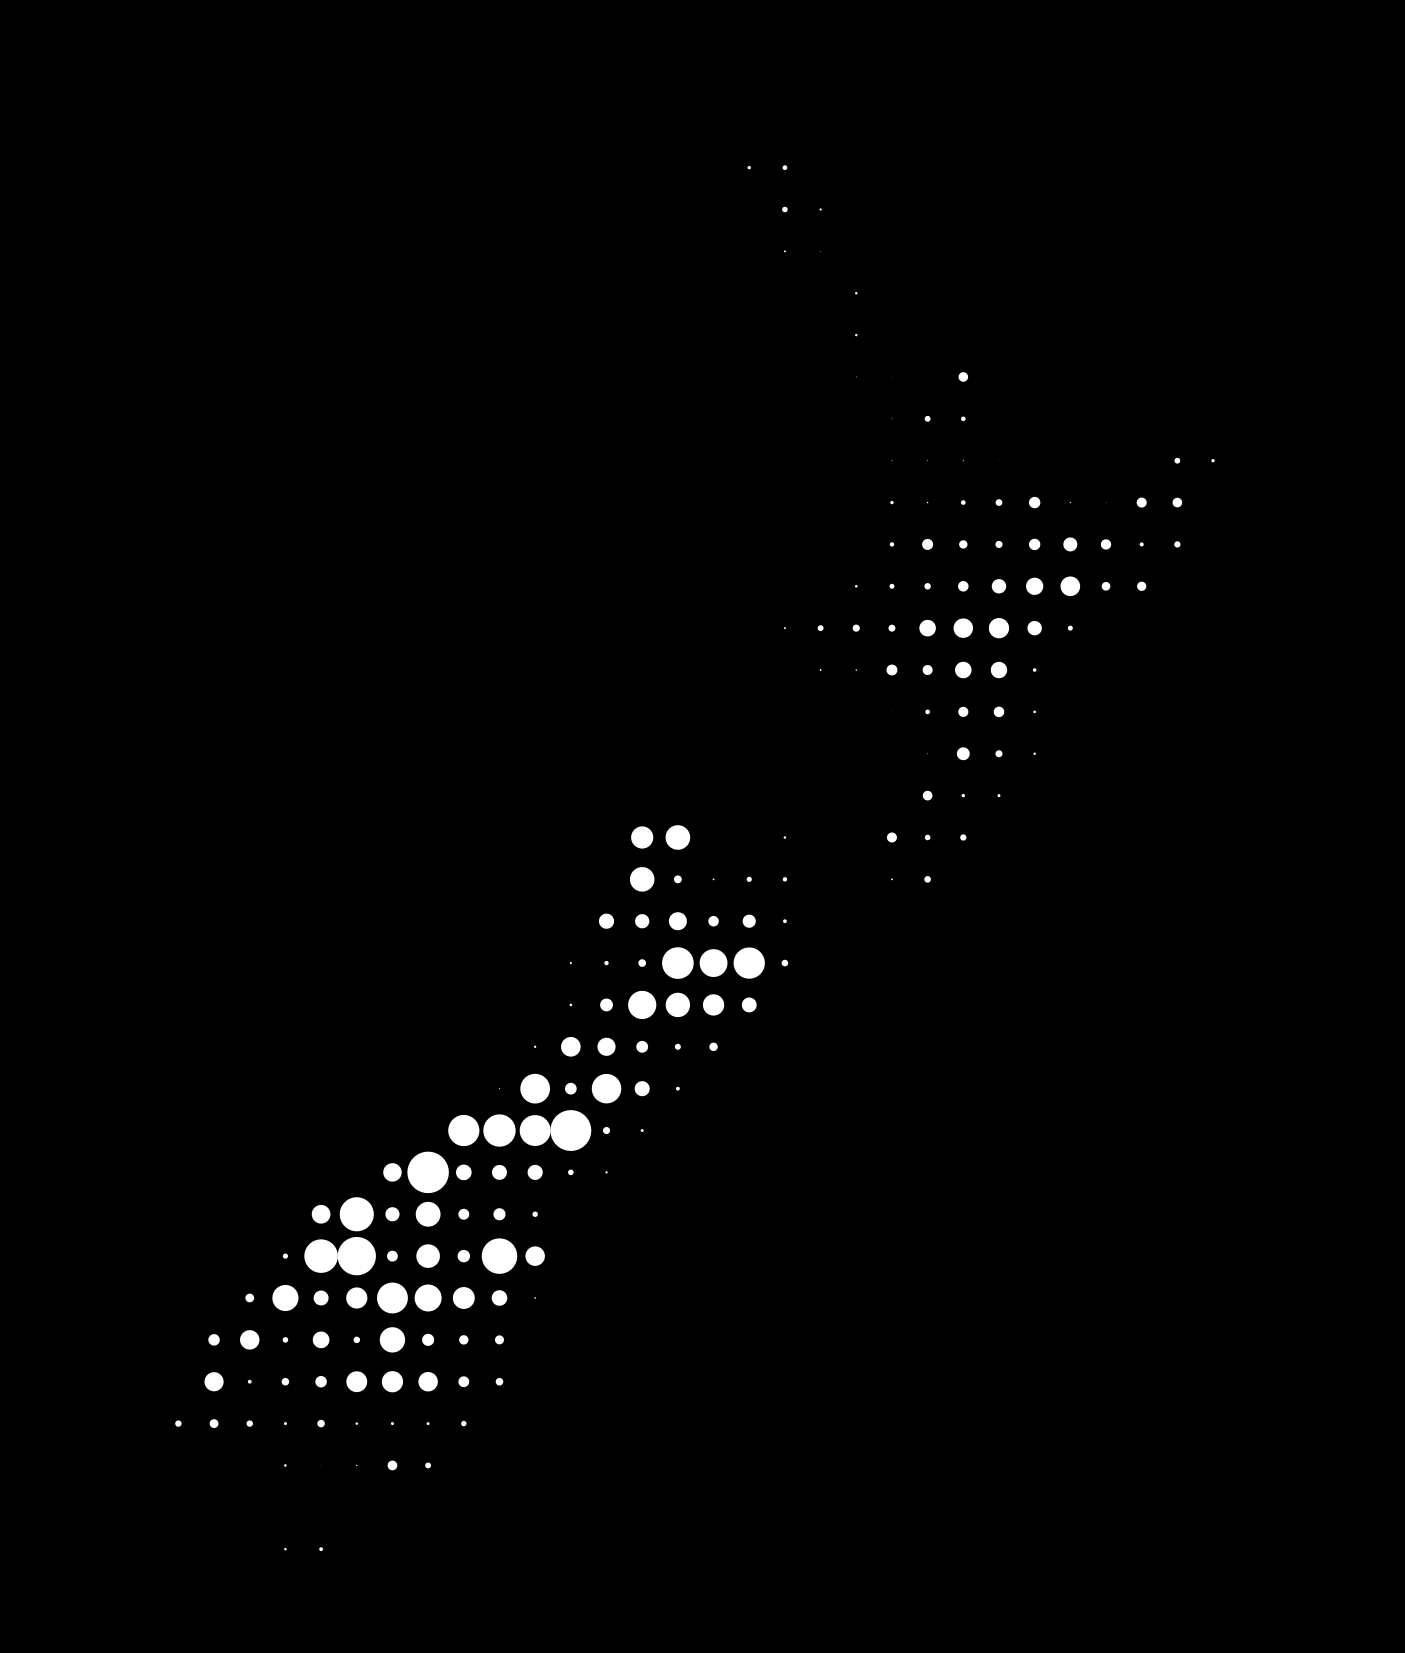
A Beautiful Raster Hack
This technique was first documented and shared by @cartocalypse on their blog here. I recommend you read that post for more background.
Firstly create an empty polygon layer. A new scratch layer with the "Polygon / CurvePolygon" geometry type will do.
Secondly set the symbology type to "Inverted Polygon". Why? Because this will generate a single feature for the map extent not covered by polygons in the current layer. And since there are no polygons the "inverted polygons" symbol gifts us a single feature that covers the extent of the map. Wonderful!
Thirdly you'll need a raster dataset. In this example I use the New Zealand 8m DEM avaialble from LINZ. This layer expresses modelled height from sea-level for the extent of mainland New Zealand.
Finally configure a Geometry Generator symbol for the layer. In my version below I've generated a 40 by 40 cell grid and read the raster value (i.e. elevation). I've used the raster value to create circles scaled to the elevation value:
with_variable(
    'raster_layer',
    '8m_DEM_ccdf4eaf_1948_423d_a50a_bfdc20912825',
    collect_geometries(
        array_foreach(
            generate_series(
                y(@map_extent_center)-(@map_extent_height/2),
                y(@map_extent_center)+(@map_extent_height/2),
                @map_extent_height / 40
            ),
            with_variable(
                'y',
                @element,
                collect_geometries(
                    array_foreach(
                        generate_series(
                            x(@map_extent_center)-(@map_extent_width/2),
                            x(@map_extent_center)+(@map_extent_width/2),
                            @map_extent_width / 40
                        ),
                        make_circle(
                            make_point(@element, @y),
                            coalesce(
                                raster_value(
                                    @raster_layer,
                                    1,
                                    transform(
                                        make_point(@element, @y),
                                        @map_crs,
                                        layer_property(@raster_layer,'crs')
                                    )
                                ),
                                0
                            )*10
                        )
                    )
                )
            )
        )
    )
)
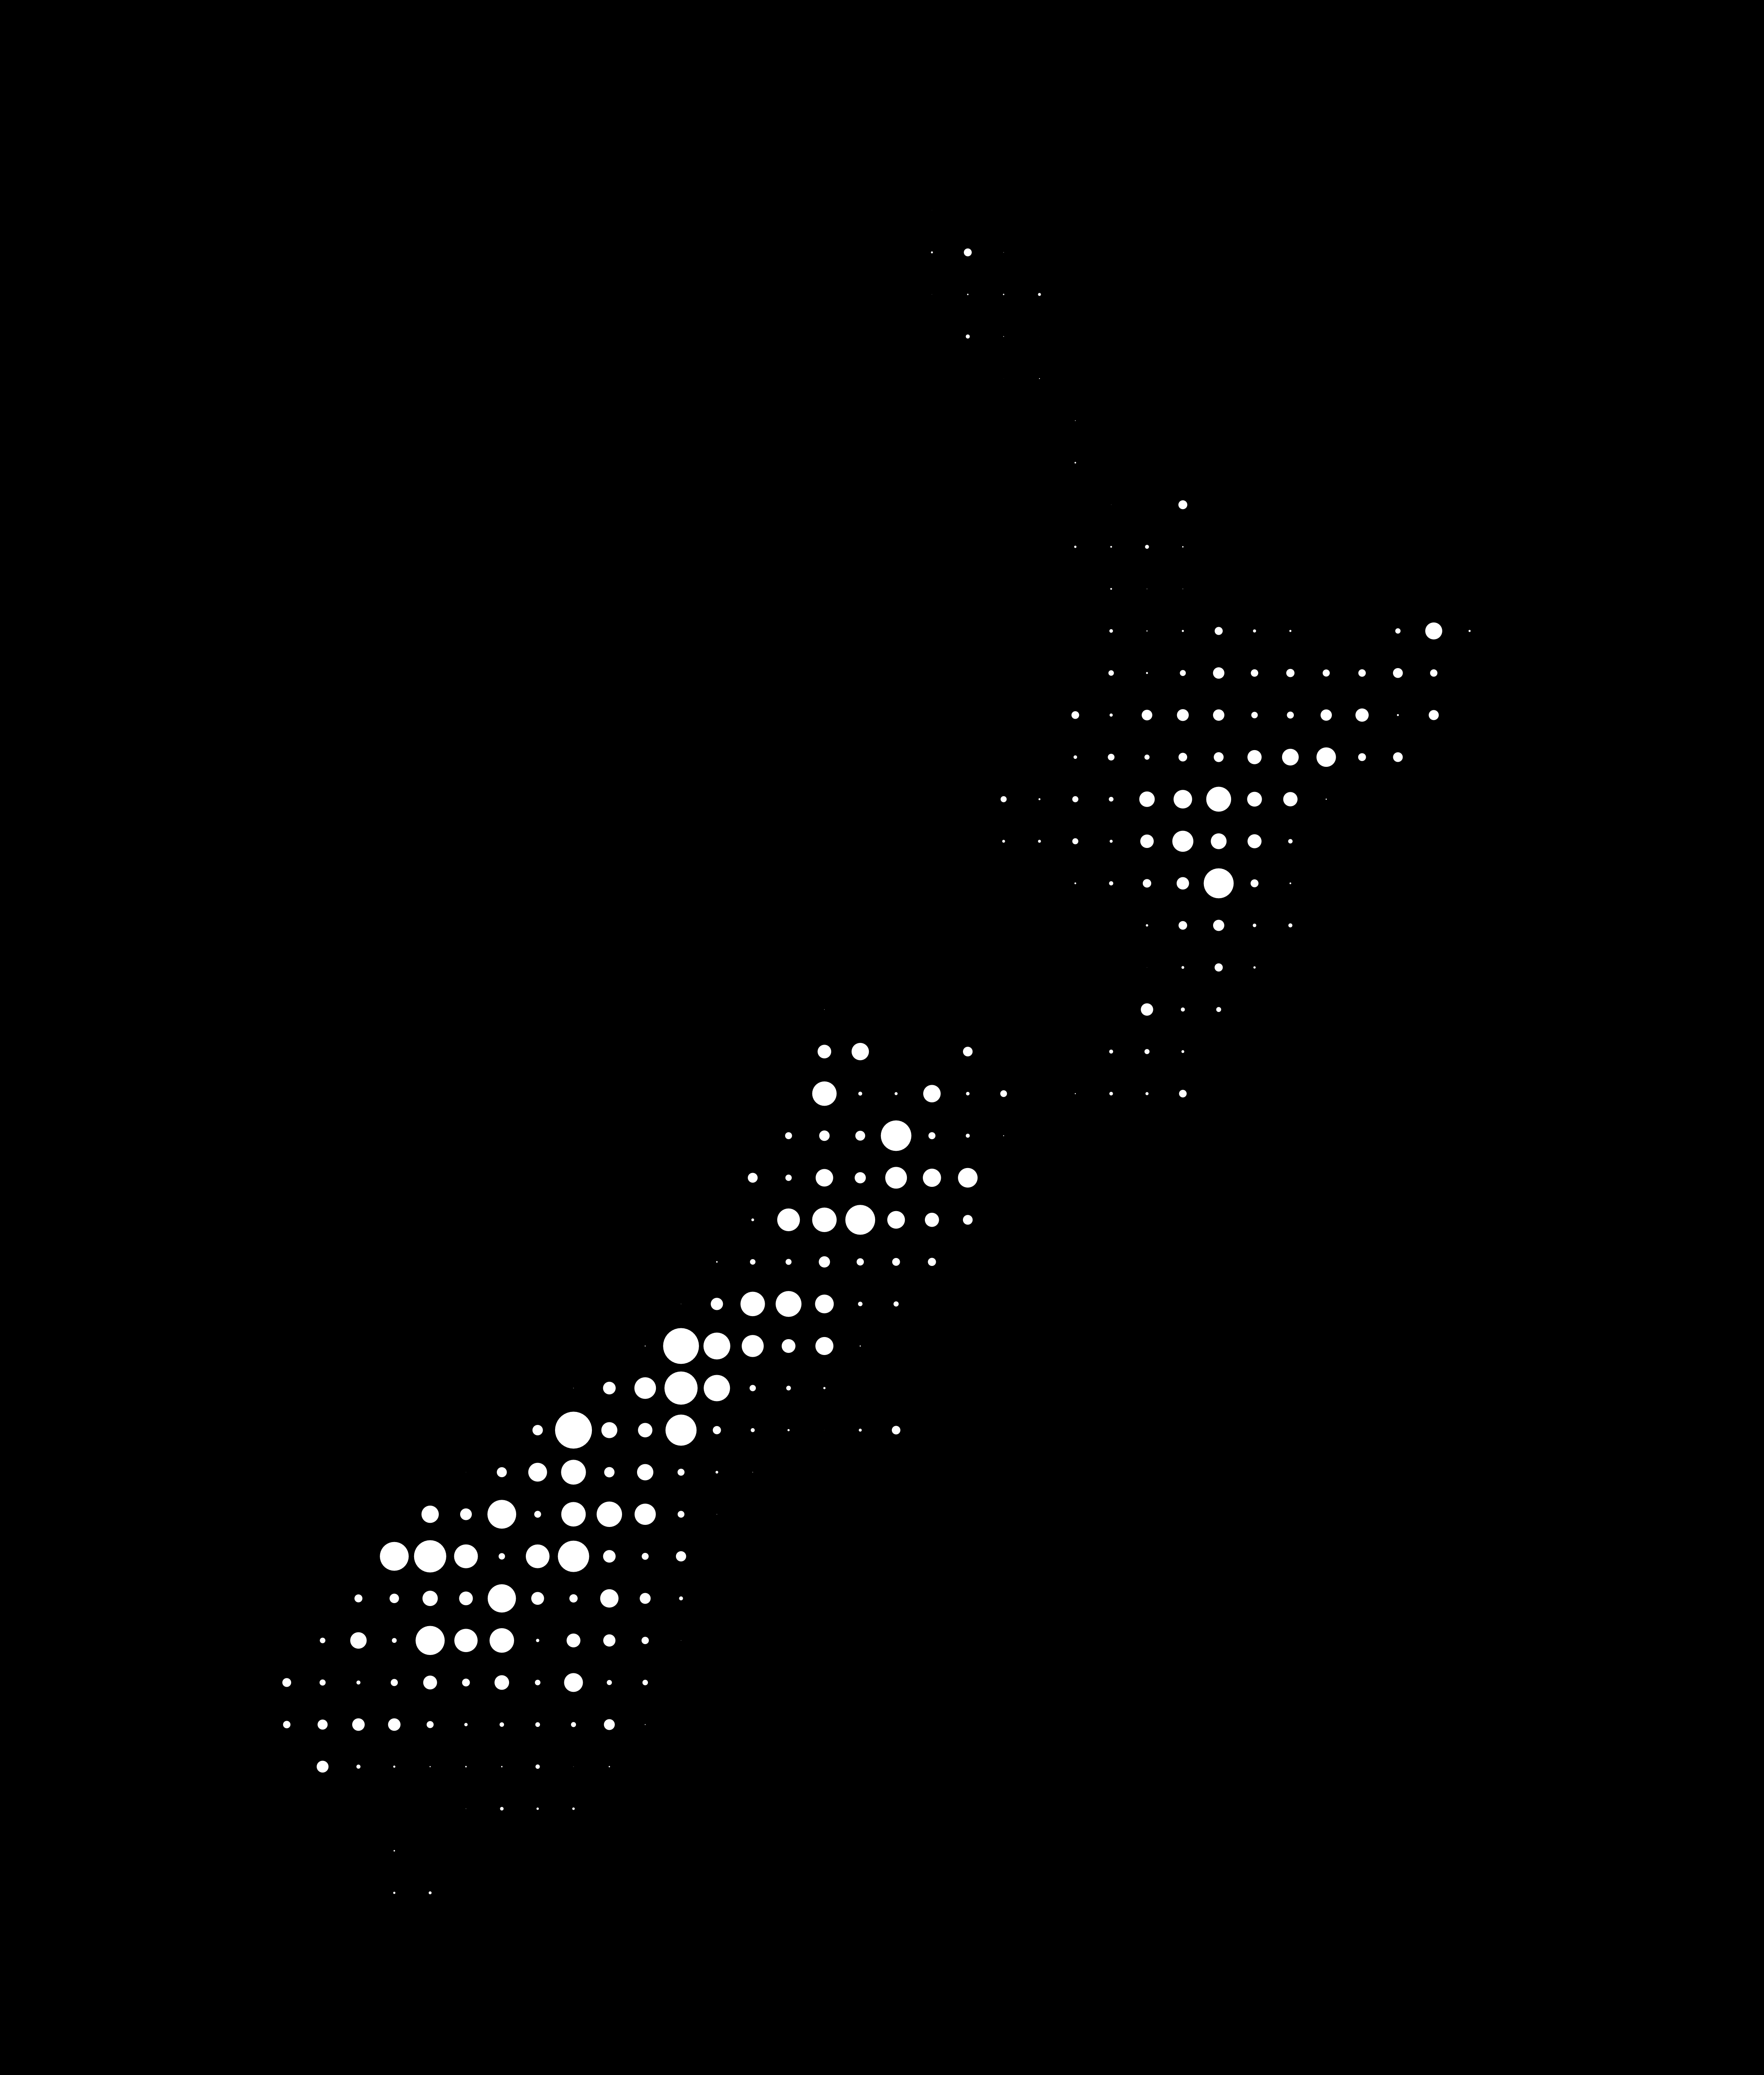
The result (using an empty scratch layer!):
Download link to a larger version
Final Notes
Geometry generators are a fun and powerful QGIS feature that extends what you can do with symbols far
beyond standard symbol options. They allow you to do more with the raw geometries of your data, without
creating intermediate layers just for display. Geometry Generators can be tricky to tame, so use the
"Expression Dialog" accessible from the (somewhat mysterious) ℇ button to get assistance and a
decent function reference. The built-in expressions are only the start - you can also use the full power of
python to create your own functions from scratch by selecting "Function Editor" from the expression dialog.
Footnotes
1. Recursively expanded to Free and Open Source for Geospatial Information Systems & State of the Map – Oceania. Hey, naming things is hard.