Random Maps, October 2014
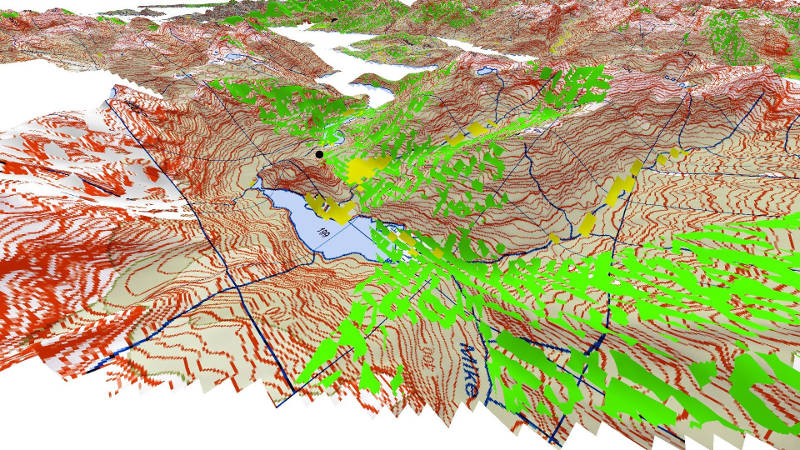
This graphic of Queenstown (New Zealand) uses a nice technique to show the incline of town streets. This is a great way to make a pedestrian-friendly transport map.
Great graphic concept! Show the incline of streets in a town, help pedestrians. pic.twitter.com/TSzw6tAAgt View on Twitter
— Bob Lehman (@fellowplanner) October 18, 2014This map of the relationship between where people live and work in Engliand shows the magnetic pull that the city of London has on English commuters. The same representation should be relatively easy to create using New Zealand data from the 2013 census.
Local version of map comparing geo-centroid of each MSOA to the workplace population weighted centroid (arrow point) pic.twitter.com/KwS7NQCeoK
— Neal Hudson (@resi_analyst) October 27, 2014
A few people think that there might be moose in Fiordland's remote and hilly back country. Auckland GIS student Alex Corkin goes hunting for for the elusive creatures using various data sources to determine the best location for CCTV cameras.
